Why Bergen County Has Five Different Median Home Prices Right Now
Five figures published online, ranging from $717,500 to $946,000, and every one of them is accurate. The gap is not an error. It is the result of three variables buried underneath every real estate statistic.
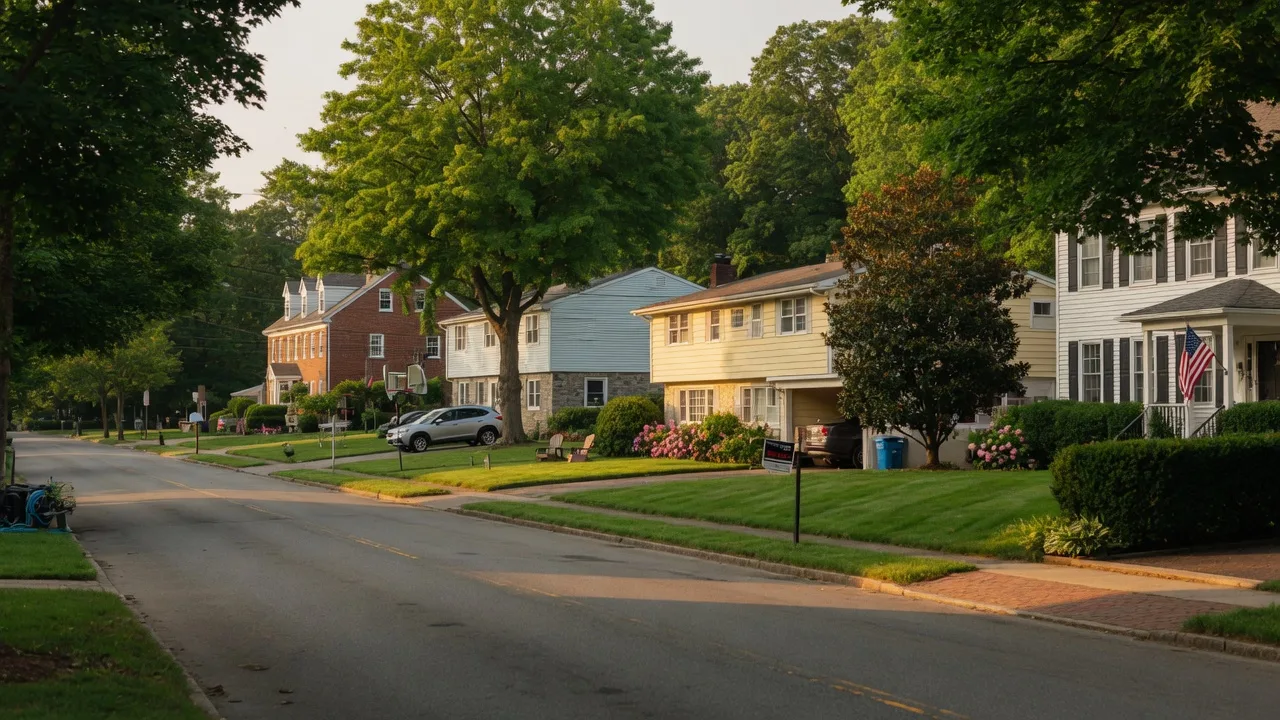
Watch: Why Bergen County Has Five Different Median Home Prices Right Now
As of August 2026, you can find five different "Bergen County median home price" figures published online, ranging from $717,500 to $946,000, and every one of them is accurate. The gap is not an error. It is the result of three variables buried underneath every real estate statistic: which property types are counted, what time window is measured, and whether the number reflects homes that actually sold or homes that are merely listed.
I ran into this last month while fact-checking my own market update. Two numbers I had used in a draft did not reconcile, so I ran them through Perplexity to trace each one back to its original publisher and check whether the context I had attached to it was the context the source actually intended. It was not. That exercise turned into the clearest lesson I have seen since I was licensed in 1993 about how easily a real, sourced statistic can still tell you the wrong thing. Here is exactly what happened, using the actual figures.
The Five Numbers, and What Each One Actually Measures
Every figure below is published, sourced, and defensible. They describe the same county in the same season.
Bergen County single-family median sale price, June 2026 alone
Up 7.3% year over year, per the New Jersey REALTORS June 2026 Local Market Update.
Bergen County single-family median sale price, year-to-date through June 2026
Up 2.4%, from the same MLS dataset pulled July 15, 2026.
Bergen County median sale price, all home types combined
For the three months ending May 2026, up 4.7%, per Redfin.
Bergen County median listing price
Per Realtor.com. This is what sellers are asking, not what buyers paid.
Bergen County median sale price per Zillow
Uses its own methodology and property-type mix.
The spread between the highest and lowest is $228,500. If you own a home in Tenafly or Leonia and you are trying to decide whether to list this fall, that spread is the difference between confidence and paralysis.
Real Example One: The Mistake I Almost Published
In a draft market piece, I paired the $946,000 single-family figure against $788,000 and framed the difference as a meaningful market signal. It was not. The $946,000 is single-family only, one month, from New Jersey REALTORS. The $787,638 is all home types, a rolling three-month average ending a month earlier, from Redfin.
Different property mix. Different time window. Different source. Different methodology. Roughly half of that $158,000 gap is simply condominiums and townhouses pulling the all-types median down, because the Bergen County townhouse-condo median in June 2026 was $575,000. I was not measuring a market shift. I was measuring the fact that condos cost less than houses, which is not news to anyone.
The correct comparison, if you want to know whether June was unusually strong, is month against year-to-date within the same property type and the same source: $946,000 in June versus $860,000 year-to-date. That is a genuine and useful finding. It says June single-family closings ran about 10% above the pace the rest of 2026 has set, which is a real seasonal peak, not a statistical artifact.
Real Example Two: The 31% Price Jump That Was Eight Houses
The same June 2026 New Jersey REALTORS report shows Bergen County's adult community segment with a median sale price of $730,000, up 31.3% year over year from $556,050. Taken at face value, that headline says the segment exploded.
Then you look at the closed-sales column. That 31.3% increase is calculated on eight closed sales in June 2026, compared to six in June 2025. At that sample size, two larger homes closing in the same month move the median enormously. The year-to-date figure for the same segment is $544,450, up 11.4%, which is a far more stable read.
This matters for Bergen County sellers considering a move to a qualifying older-persons (55+) community. If you own a home in Teaneck or Englewood, the honest answer is that prices are rising meaningfully but the monthly numbers in that segment are too thin to time a decision around.
Real Example Three: Asking Price Is Not Sale Price
In late July 2026, one market data publisher reported a Bergen County median list price of $939,497, while the federal FRED database recorded a median listing price of $796,500 for the same month. Both are listing prices, and they still differ by $143,000, because they draw from different listing pools and different snapshot dates.
Neither one tells you what a buyer actually paid. For that you need the percent-of-list-price-received figure, and in Bergen County in June 2026 that was 105.5% for single-family homes. Sellers received, on average, more than asking. A buyer who budgets to the median list price and assumes room to negotiate below it is planning for a market that does not currently exist here.
How I Cross Check a Statistic Before I Publish It
My working rule is that no figure goes into a market update, a listing presentation, or a client email until I have seen the page it came from. Perplexity has become the fastest way I have found to do that, because it returns the underlying sources with links rather than a synthesized answer I would then have to verify separately.
The process takes a few minutes. I ask for the figure, then I ask the follow-up questions that actually matter: which property types are included, what exact time period does this cover, is this a sale price or a listing price, and which organization compiled it. Then I open the source page and confirm the answer with my own eyes.
The Three Questions to Ask About Any Real Estate Statistic
Before you let a number change your decision, ask these three things:
What property types are in it?
Single-family only, or single-family plus condos, townhouses, and older-persons communities blended together?
What time window does it cover?
A single month, a rolling three-month average, or year-to-date?
Is it sold or listed?
Sale prices are facts, recorded at closing. Listing prices are asking prices.
A fourth question worth adding: what is the sample size? Any percentage change built on fewer than about 20 transactions should be treated as directional at best.
Why This Is Getting Harder, Not Easier
Most people now begin their housing research by asking ChatGPT, Perplexity, or Google's AI Overviews what homes cost in their town. These tools return a number quickly and confidently. What they will not do unless you ask is tell you that the number is a rolling three-month all-property-types average from one aggregator, while the figure your neighbor quoted came from a single-month single-family MLS report.
I use AI extensively in my practice, including to audit my own work, which is exactly what happened here. But retrieval is not interpretation. The AI gives you the data point and, if you press it, the source. Someone who has watched Bergen and Hudson County transactions close since 1993 tells you which data point applies to your house, on your street, in the season you are actually selling. That gap between data and judgment is the entire job now.
What the Bergen County Numbers Actually Say Right Now
Reading all sources together, here is the defensible summary as of the June 2026 data. Bergen County single-family homes are appreciating, with a year-to-date median of $860,000 (up 2.4%) and a June peak of $946,000 (up 7.3%). Inventory is tight at 2.5 months of supply, homes are selling in about 28 days, and sellers are receiving 105.5% of list price. The townhouse-condo segment is softening in relative terms, with inventory up 35.6% year over year and months of supply up to 3.7, which gives condo buyers in Fort Lee and Cliffside Park more room than single-family buyers have.
That is a seller's market for detached houses and a more balanced market for condominiums, in the same county, at the same time. One median price could never have told you that.
Frequently Asked Questions
Why do Zillow and Realtor.com show different Bergen County median prices?
Zillow reported a Bergen County median sale price of $717,500 while Realtor.com showed a median listing price of $763,500, and the two are measuring different things. Zillow's figure reflects homes that closed, while Realtor.com's reflects what sellers are currently asking.
What is the actual median home price in Bergen County, NJ in 2026?
It depends on what you are measuring. The Bergen County single-family median sale price was $946,000 in June 2026 and $860,000 year-to-date through June, per New Jersey REALTORS. If you include condominiums and townhouses, the blended figure drops to roughly $788,000.
Should I trust the home value estimate an AI tool gives me for my Fort Lee condo?
Treat it as a starting point, not a valuation, and always ask the tool for its source. A Fort Lee condominium priced against the Bergen County all-types median of roughly $788,000 would be badly mispriced when the actual townhouse-condo median is $575,000.
Is now a good time to sell a single-family home in Bergen County?
The June 2026 data favors sellers of detached homes. Bergen County single-family inventory sat at 2.5 months of supply, homes averaged 28 days on market, and sellers received 105.5% of list price on average.
Why did the Bergen County older-persons community market show a 31% price increase?
That figure came from only eight closed sales in June 2026, compared with six in June 2025, which is too small a sample to be reliable. The year-to-date adult community median of $544,450, up 11.4%, is the more dependable number.
Have a Number You Are Not Sure About? Let's Trace It Together
If you have seen a figure about your town or your property type and you cannot tell whether it applies to your situation, send it over and we will trace it to its source together. No obligation, no pitch.
Or take the 7-question quiz (about 90 seconds) and receive curated resources matched to your situation:
Take the QuizScott Selleck | The Selleck Group
Keller Williams City Views Realty
Warm regards,
Scott Selleck
Broker / Sales Associate
The Selleck Group | KW City Views Realty
SRES, e-PRO | AI-Enabled Listing and NJ to FL Transition Specialist
Licensed since 1993. 500+ transactions closed.
2200 Fletcher Avenue, Suite 502, Fort Lee, NJ 07024
Cell: (201) 970-3960 | Office: (201) 592-8900
scott@sellecksellsnj.com | SelleckSellsNJ.com
Commuting and community across Bergen, Hudson, Palm Beach and Broward:
https://northernnj.sellecksellsnj.com
Book a call: https://meet.sellecksellsnj.com

NJ Real Estate Broker / Sales Associate #9236275. Licensure does not imply endorsement. | FL Real Estate Sales Associate License #SL3588731
Equal Housing Opportunity: Equal Housing Opportunity Statement
Keller Williams City Views Realty and Keller Williams Boca Raton Realty. Each office is independently owned and operated.
This content was created with AI assistance and reviewed for fair housing compliance.
Disclaimer
This is educational content, not financial or legal advice. Consult a licensed professional for your specific situation. Real estate markets and data sources change frequently. Scott Selleck and The Selleck Group are not attorneys, CPAs, or financial advisors. Before making any real estate or financial decisions, consult with a licensed professional who can review your specific situation. Equal Housing Opportunity.